What is Dimension and Metrics Analytics with Examples

Looking for Dimension and Metrics Analytics? A dimension is a descriptive trait or feature of an object that can have multiple values. The total number of sessions is represented by the metric Sessions. Pages/Session is a metric that measures the average number of pages viewed per session. And the metric Pages/Session is the average number of pages viewed per session.
For measuring website traffic and business performance, Google Analytics has become the industry standard. This article will cover the fundamentals of Google Analytics reports, including ABC (Acquisition – Behavior – Conversion), Dimensions vs. Metrics, and common KPIs.
What is Dimension and Metrics Analytics:

Dimensions and metrics, in particular, are critical building pieces. Data is described by dimensions. A geographic location, for example, can be specified using coordinates, a zip code, a city, or a country. These are all measurements. Chicago, Los Angeles, or New York could be used as a city dimension value.
Dimensions are used to organize, segment, and analyze data and can be added or applied to any report. Geographical locations, demographics, traffic sources, landing pages, and more are examples of Google Analytics dimensions. Data is measured through metrics.
The default Dimension and Metrics Analytics are maintained in all Google Analytics reports. However, you will need to apply extra dimensions and metrics to get the most out of your reports and conduct a more in-depth analysis.
While tracking website performance is simple when all data is already in Google Analytics, integrating data into Google Analytics from sources that aren’t directly supported by it might be difficult.
Understanding Dimension and Metrics Analytics:
In Google Analytics, a Google Dimension is any property that represents the amount and characteristics of website visitors and may be used to characterize, segment, organize, and sort data according to needs. Medium, Country, Language, Device Category, and other Google Dimensions are available in Google Analytics.
Assume a 30-year-old male in Islamabad, Pakistan, uses his smartphone to browse a website via a Facebook ad; the dimension attributes would be as follows:
Dimension and Metrics Analytics:
- Gender: Male
- Age: 25-34
- Location: New Delhi, India
- Source/Medium: Facebook/paid_social
- Device Category: Mobile
Understanding Google Metrics in Google Analytics:
Google Metrics are numerical data measurements that illustrate how a website performs in relation to a given Google Dimension, and also how many other visitors come from that country, as well as extra information like the Average Session Duration, Bounce Rate, and so on.
The following figure, for example, depicts the number of users who arrived via desktop, mobile, and tablet devices, as well as other information about user behavior such as average session duration, bounce rate, and so on.
What are some common Dimension and Metrics Analytics?
The following are the categories in which all common Google Metrics may be found:
Common Google Metrics in Google Analytics:
- Google Metrics for Acquisition
- Google Metrics on Behaviour
- Google Metrics for Conversions
What are some examples of Dimension and Metrics Analytics?

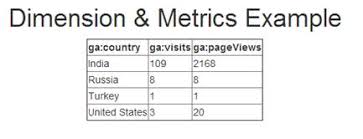
The country would be an example of a dimension. So it’s the US, Canada, and Pakistan. It may be any city, such as Orlando, San Francisco, or London. It’s also possible that it’s a page. This could be the page title or the actual URL. As you can see, these aren’t numbers at all. They can’t be measured in any way. These are attributes that can be used to further describe or break down your data.
A metric is a numerical number that is associated with a dimension. A page title, for example, is a dimension, but a page view is a metric. A dimension will display in the first column of every core report in Analytics.
The Relationship Between Dimension and Metrics Analytics:
As previously said, not all of these will fit together, and it can be difficult to determine what can and cannot be used together. Google offers a pretty great tool that allows you to select some dimensions and it will highlight the different metrics that you can use to conduct a little more digging into your data.
What criteria do you use to determine which KPIs are most significant for your website?
Your SMART website objectives are a good place to start. Review your objectives and techniques for achieving them, and then move backward from the intended result.
Let’s take a look at some of the most common Dimension and Metrics Analytics KPIs and how they’re used to track the development of your website toward certain goals.
Acquisition – Behavior – Conversion (ABC)
Acquisition (amount of traffic to your website), Behavior (degree of engagement on your website), and Conversions are the ABCs that Google Analytics uses to group data and reports (effectiveness of your website is converting visitors to customers or leads).
Why ABC Are the Most Important KPIs?
A conversion occurs when a visitor completes a task on your website that is critical to your company’s success. Conversion tracking ultimately determines how well your website performs in terms of overall business performance.
Regardless of your website’s specific objectives, assessing the Acquisition – Behavior – Conversion (ABC) cycle is essential to attaining them for the following reasons:
Dimension and Metrics Analytics:
The acquisition is a metric that monitors the amount of traffic that your website receives and tells you how it gets those visitors.
Behavior indicates how well your website engages users, as well as which pages they visit and what activities they do on the website.
Conversion: The efficacy of your website in persuading website visitors to take the desired action is measured by conversion.
Shortcomings of Dimension and Metrics Analytics:
While Google Analytics can interest businesses in keeping a detailed log of everything that occurs on their website, it cannot assist businesses in understanding the reasons for the bulk of user actions.
For example, about Google Analytics dimensions and metrics, let’s say a company’s new product page has an Exit Rate of 80%. This means that eight out of ten people who visit that page leave. Businesses can study numerous Dimensions and Metrics to generate a few ideas, but they won’t be able to comprehend the true explanation for this behavior until they know what users were looking at on the web page at the time.
Businesses can combine Google Analytics and other Behavioural Analytical technologies to produce the following in order to understand the reason for the above-mentioned user behavior:
Dimension and Metrics Analytics:
Heat Maps: They illustrate which buttons and touchpoints receive the most and least engagements on each page by aggregating visitor behavior.
Session recordings: These are recordings of actual website actions taken by visitors.
User Feedback: On-site surveys such as Net Promoter Score and Customer Effort Scores enable customers to explain their online activity.
What is the Difference Between Dimension and Metric Google Analytics:

Dimensions vs Metrics Google Analytics: The difference between metrics and dimensions google analytics is that in Google Analytics, the distinction between metrics and dimensions is that while they both describe data, they do so in different ways.
Dimensions employ words and letters to describe facts qualitatively. To define the data category we’re talking about, dimensions are used to highlight the quality of your things, such as purchase statuses like “sold” and “on hold,” office departments, color options, user groups, or cities.
Dimension and Metrics Analytics: Exit Page, Screens, Browser, Campaign, Landing Page, and City are all instances of pre-made default dimensions in Google Analytics that you can use. Dimensions appear in all of your reports, but they are applied differently to different types of data, so don’t expect identical dimensions for each chart or table. To organize, split, and structure your data, use dimensions.
You can also build custom and secondary dimensions in Google Analytics to store other sorts of data that you get from Data Import, the Google Analytics API dimensions and metrics, or the tracking code.
10 Most-Tracked -Dimension and Metrics Analytics:
The following are the top ten Google Analytics metrics and dimensions to keep an eye on:
Users: Individuals that visit a website are referred to as users.
The bounce rate is the overall proportion of all sessions on a website that has bounced.
Sessions are defined as a collection of user interactions with a website over a set period of time.
Average Time on Page: The average time a user spends on a single page is referred to as average session duration.
Percentage of New Sessions: The percentage of total user sessions obtained from new users to a website is displayed as a percentage of total user sessions.
Sessions by Channel: Sessions by channel refers to the number of sessions assigned to each channel grouping in Dimension and Metrics Analytics.
Pages Per Session: Pages per session refers to the number of pages viewed by a single user during a given session.
Goal Completions: The number of times a website visitor completes a certain goal on a website is defined as the goal completions measure.
Pageviews, Unique Pageviews: Pages visited by the same person many times are counted as well.
PageViews by Page: is a metric that shows the total number of pageviews obtained by each page of a website over a period of time.
Pageviews, Unique Pageviews: Pages visited by the same person many times are counted as well.
PageViews by Page: is a metric that shows the total number of pageviews obtained by each page of a website over a period of time.
Source/Medium and Channels: The medium metric refers to how a person arrives at a website, such as through non-paid search engine traffic, PPC, and so on.
Below are some more Post related to Dimension and Metrics Analytics, so what to read next:
See Also:
- What is a Metric in Google Analytics:
- Google Analytics QR Code Tracking
- What is Google Tag Manager used for:
- What is Google Analytics tracking ID/Code
- 10 Best Key Dimensions and Metric in Google Analytics
- Keyword Research: How to Target and Prioritize keywords
What is Dimension and Metrics Analytics with Examples


