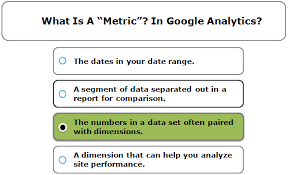
Want to know what a metric is in Google Analytics Dimensions? Metrics and dimensions enable segmentation, organization, and analysis of traffic data. Dimensions and metrics are used in Google Analytics reports. Metrics are the quantitative measurements of data used in most reports, while dimensions are the labels used to explain them.
Knowing how to apply the appropriate terminology in the data analytics area allows you to go deeper into the meaning of things, prevent technical errors, and simply shed light on knowledge when a chance comes.
What is a Metric in Google Analytics: Google Analytics Dimensions-
The properties that can be applied to characterize, segment, organize and sort data are known as dimensions. Dimensions include the following:
- Medium
- Browser
- Country
- Language
- Campaign
- Device Category
The dimension ‘Device Category,’ for example, specifies the type of device used to access a website, accepts the values ‘desktop, mobile, and tablet,’ and may be used to sort traffic amongst the three devices.
The dimensions you read about earlier in Google Analytics have a numerical value. The metric is the numerical value that corresponds to the country, browser, or any other dimension you’ve chosen to evaluate in a table.
Common GA metrics: What is a Metric in Google Analytics?
The most frequent GA metrics—those that appear by default when you log in—are usually divided into three categories: acquisition, behavior, and conversions.
1) Metrics connected to acquisition Answer questions like, “How did these folks get here?” and “Who are they?”
2) Behavior-related metrics provide answers to questions like: how did people act once they arrived?
3) Conversion-related analytics provide answers to inquiries like how many people converted and how much money we made.
What measures and dimensions alone are unable to reveal
First and foremost, dimensions and metrics are quite helpful in understanding the overall performance of your site as well as the performance of any of its particular pages. They can help you in a variety of ways:
Draw a diagram of your website’s ecosystem, indicating where users come from and how they navigate your site.
Comparing behaviors across segments allows you to assess performance across various groups (e.g. desktop vs. mobile users, landing page conversion rates, and so forth.)
Determine which pages have the greatest potential to affect your company’s growth goals and optimize accordingly by identifying priorities and quantifying their impact.
GA + Behavior Analytics
What is a Metric in Google Analytics: Don’t stop at dimensions and metrics: there’s a lot more to learn about your website visitors, and tools like heatmaps, session records, and on-site surveys may help you do so. When you combine the data from Google Analytics with the information gleaned from behavioral analytics tools, you’ll gain a clearer view of:
- DRIVERS are the folks who bring people to your website.
- BARRIERS that could deter them or force them to leave
- HOOKS that encourage folks to change their minds
As a result, you can edit, fix, update, optimize, and/or improve your website.
Summary: What is a Metric in Google Analytics
Metrics like Pages per Session, Screenviews, and Average Session Duration are all popular in Google Analytics.
In a Google Analytics report, metrics are expressed as numbers (number values, percent, $, time): they are quantitative measurements of data that demonstrate how a website performs with respect to a given dimension.
For example, KPIs for the Device Category dimension include the number of ‘Users’ who came from desktop, mobile, and tablet devices, as well as their ‘Average Session Duration.’
Difference Between Dimension and Metric in Google Analytics:
In Google Analytics, the distinction between metric and dimension is that while they both describe data, they do so in different ways.
The concept of dimension refers to a measurement of something in a specific direction, such as height, width, or length. The term metric refers to a system of measurement that includes liters, inches, centimeters, and other units.
You can normally find both dimensions and metrics everywhere. These two names are synonymous and prevent you from creating any dashboard, table, or Google Analytics report you can think of.
Now that you’re aware that dimensions and metrics are universally necessary for data analytics.
Best Key Metrics – What is a Metric in Google Analytics:
Marketers use Google Analytics to learn how marketing campaigns operate and how a website’s user experience influences conversion and retention.
It’s easy to become overwhelmed with Google Analytics’ hundreds of metrics and dimensions.
We put together a list of 12 key indicators for marketers, including where to access them in the Google Analytics dashboard and via the API, as well as how to use them to make data-driven business choices.
Some Basic About What is a Metric in Google Analytics:
The Google Analytics Dashboard for Marketers:
To filter down sets of metrics, dashboards often allow segmentation by one or more dimensions.
These data points can also be collected using the GA: identifier syntax in the Google Analytics Core Reporting API. You can query the metrics and dimensions via the API, or you can use a third-party ETL tool like Stitch to integrate them into a data warehouse for more extensive analytics.
The GA dashboard is organized into four sections:
- The audience allows you to learn more about your clients by providing data on demographics, geography, retention, and device technology.
- The acquisition demonstrates how customers arrive at your website.
- Behavior- What clients do on your website is described by their behavior.
- Conversions track whether customers do the activities you want them to do.
Now come 14 metrics that all marketers should consider and understand when reviewing Google Analytics data:
What is a Metric in Google Analytics? & 12 Best Metrics:
Audience:
- Number of users and sessions
- Average session duration
- Average pages per session
- The ratio of new to returning visitors
- Bounce Rate
Acquisition:
- Organic vs. paid sessions
- Google Ads
- Search Console – Queries
Behavior:
- Newsletter opens
- Average time on page
- Top queries in search
- Top 10 landing pages
- AdSense revenue
Conversions:
- Goal conversion rate
Default dimension reports: What is a Metric in Google Analytics?
The default dimensions are those that are already present in GA reports. They are ready to use in the following dimensions:
The default dimension can be seen in the following examples:
- Gender
- Age
- City
- Source / Medium
- Keyword
- Device Category
- Browser
- Operating System
Custom dimension properties and configuration values:
For each hit, the value of the custom dimension is calculated and sent.
When a user hit is sent with the value of a custom dimension, and the custom dimension has a multi-level scope, only the hit with which the value was sent receives the value of the custom dimension.
What is a metric in Google Analytics? Every dimension in Google Analytics has the following five properties:
- Name
- Index
- Scope
- last Chang
- State
Classification of the Dimension in Google Analytics—in terms of Scope:
GA dimensions can be classified into the following categories in terms:
- Hit-level dimensions
- Session-level dimensions
- User-level dimensions
- Product-level dimensions
How can I make dimensions in Google Analytics reports?
By default, you can only add one primary dimension and one secondary dimension to a GA report at a time.
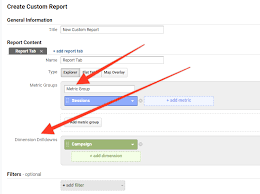
If you want to add more dimensions to your Google Analytics report, follow these five steps:
Navigate to your GA account’s main reporting view, and then click the ‘+’ New Custom Report’ option.
User-defined Custom Metric: What is a Metric in Google Analytics?
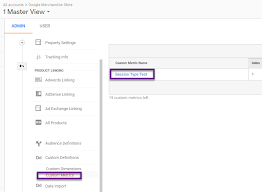
User-defined metrics are custom metrics. When we need to measure the features of a dimension that no existing metrics can assess, we use custom metrics.
For example, if you had a custom dimension in GA for keywords that resulted in a phone call, one of the attributes of this dimension could be the ‘number of phone calls generated by each phrase.’
What is a Metric in Google Analytics? Custom metrics allow you to import data that Google Analytics does not capture automatically, such as CRM data, logged-in users data, and so on, and correlate it with GA data. Custom metrics can be used with both predefined and custom dimensions.
How to delete a custom dimension and metric in Google Analytics:
You cannot delete a custom dimension or custom metric that you have created in your GA property, but you can change or disable it.
Google advises against reusing or editing a custom dimension or metric since it can cause data integrity concerns that are difficult to resolve. As a result, only create a custom dimension or metric after thorough consideration and preparation.
The 10 Most Tracked Metrics-
What is a Metric in Google Analytics is a free tool that allows marketers to measure more than 200 variables across the whole funnel, from acquisition to conversion.
While Google Analytics data provides insight into visitor behaviors throughout the funnel, the most important metrics to analyze may be divided into three categories.
- Is my website growing?
- Is my website converting?
- What are people doing on my website?
There are dozens (if not hundreds?) more GA metrics to keep track of. However, starting with these ten regularly tracked GA indicators will provide you with a good overview of how your campaign is performing.
The 10 most important Metrics:
- Users
- Bounce Rate
- Sessions
- Average Session Duration
- Percentage of New Sessions
- Sessions by Channel
- Pages Per Session
- Goal Completions
- Pageviews
- Pageviews by Page
What is a Metric in Google Analytics Setup? It’s simple to set up with just a few clicks, and no coding is necessary.
Follow these three basic steps to set up the dashboard:
- The first step is to obtain the template.
- Integrate Databox with your Google Analytics account.
- Wait a few seconds for your dashboard to populate.
What are some recommended free resources for learning Google Tag Manager?
What is a Metric in Google Analytics, and some free resources: Here are some recommended options:
Google Tag Manager Help Center: The official Google Tag Manager Help Center provides comprehensive documentation, guides, and tutorials to help you get started with Google Tag Manager. It covers various topics, including setup, implementation, troubleshooting, and advanced features. Access it at Tag Manager Help
Google Tag Manager Fundamentals Course: Google offers a free online course called “Google Tag Manager Fundamentals” on its Analytics Academy platform. This course provides step-by-step instructions and hands-on exercises to learn the basics of Google Tag Manager. Enroll in the course at Google Analytics Academy
YouTube Tutorials: Many experienced digital marketers and Google Tag Manager experts share tutorials and walkthroughs on YouTube. Search for channels like “MeasureSchool,” “Simo Ahava,” and “Loves Data” for in-depth video tutorials on Google Tag Manager.
See Also:
- What is Google Tag Manager used for:
- What is Google Analytics tracking ID/Code
- 10 Best Key Dimensions and Metric in Google Analytics
- Keyword Research: How to Target and Prioritize keywords
What is a metric in google analytics
What is a metric in google analytics quizlet
What is a metric in google analytics Dimension
Analytics metrics
Dimension and metrics analytics
GA dimensions and metrics