Python libraries for data analysis have gained significant popularity in the fields of mathematics and scientific computing due to their extensive collection of powerful libraries. In this blog post, we will explore some of the essential Python libraries that enable efficient mathematical operations, numerical computing, and data analysis. We will delve into the capabilities of NumPy, SciPy, SymPy, Matplotlib, and Pandas, which empower users to tackle complex mathematical problems and gain valuable insights from their data.
In Python, libraries (also referred to as modules or packages) are collections of pre-written code and functions that serve specific purposes. These libraries were created to provide a wide range of functionalities and tools, enabling developers to perform various tasks without having to write all the code from scratch. Python libraries are an essential component of the language’s ecosystem, as they promote code reuse, simplify development, and enhance productivity.
Here are some key aspects of Python libraries:
- Reusability: Python libraries contain functions and classes that can be imported into your code, allowing you to utilize pre-built functionality without recreating it. This promotes code reusability and reduces the need to reinvent the wheel.
- Specialization: Libraries are designed to address specific tasks or domains. For example, the NumPy library is specialized for numerical and mathematical operations, while the Pandas library is tailored for data manipulation and analysis.
- Modularity: Python libraries are typically organized into modules, making it easy to import only the parts of the library that you need for a particular task. This modularity keeps your codebase clean and efficient.
- Community-Driven: Many Python libraries are open-source and have active communities of contributors and users. This ensures ongoing development, bug fixes, and the availability of resources and support.
- Extensibility: Some libraries are designed to be extensible, allowing developers to add custom functionality or build upon existing features.
- Standard Library: Python also includes a standard library, which is a collection of modules that come with the language. These modules cover a wide range of tasks, such as file I/O, regular expressions, networking, and more. You can use them without installing any additional packages.
Common Python libraries include:
- NumPy: for numerical and mathematical operations.
- Pandas: for data manipulation and analysis.
- Matplotlib: for data visualization.
- Scikit-Learn: for machine learning and data mining.
- Requests: for making HTTP requests.
- Beautiful Soup: for web scraping
- Django and Flask: for web development.
- SQLAlchemy: for working with databases.
- Tkinter and PyQt: for building graphical user interfaces (GUIs)
- TensorFlow and PyTorch: for deep learning and artificial intelligence.
These libraries offer a wide range of functionalities for data manipulation, analysis, visualization, and machine learning, enabling data scientists and analysts to effectively explore and derive insights from their datasets.
What Python library is used for data analysis?
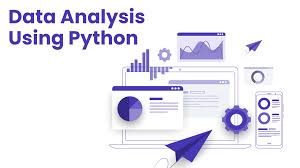
One of the most widely used Python libraries for data analysis is Pandas. Pandas is a powerful and versatile library that provides high-performance data structures and data analysis tools. It offers a range of functions and methods for manipulating, analyzing, and cleaning structured data, making it an essential tool for data scientists and analysts.
Pandas includes two primary data structures:
- DataFrame: A two-dimensional table-like data structure that can store data of various types in rows and columns. Dataframes are often used for tasks like reading and writing data from different file formats, data cleaning, data exploration, and basic data analysis.
- Series: A one-dimensional labeled array that can hold a single type of data, similar to a column in a spreadsheet. Series are often used for time series data, data indexing, and simpler data manipulations.
Pandas provides functions and methods for:
- Reading and writing data from various file formats (CSV, Excel, SQL, etc.)
- Data cleaning, missing data handling, and data preprocessing
- Data selection, indexing, and filtering
- Aggregating and summarizing data
- Visualization and basic data exploration
With its wide range of functions and methods, Pandas simplifies complex data analysis tasks and allows users to efficiently explore and extract insights from their datasets. Its seamless integration with other libraries, such as NumPy and Matplotlib, further enhances its capabilities and makes it a popular choice for data analysis in Python.
Benefits Of Using Python For Data Science
Python has gained popularity in data science due to its numerous benefits. Python’s ease of use, extensive library ecosystem, strong community support, integration capabilities, machine learning tools, reproducibility, and cross-domain applications make it a popular and powerful choice for data scientists.
It offers a wide range of powerful libraries and frameworks, including NumPy, Pandas, and SciPy, which provide extensive functionality for data manipulation, analysis, and modeling. Python’s simplicity and readability make it accessible to beginners, while its versatility enables experienced data scientists to build complex algorithms and workflows. The language benefits from a large and active community, contributing to a rich ecosystem of resources and support. Python’s integration capabilities, scalability, and platform compatibility make it a flexible choice for data science projects.
Python offers several significant benefits for data science:
- Easy to Learn and Use: Python has a straightforward and readable syntax, making it accessible for beginners and experts alike. Its simplicity allows for faster development and easier debugging.
- Vast Ecosystem of Libraries: Python has a rich ecosystem of data science libraries, including NumPy, Pandas, Matplotlib, and SciPy. These libraries provide powerful tools for data manipulation, analysis, visualization, and statistical modeling.
- Strong Community Support: Python has a large and active community of data scientists and developers. This community contributes to the development of libraries, provides support through forums and online resources, and shares code and best practices, fostering collaboration and continuous improvement.
- Integration with Other Languages and Tools: Python can be easily integrated with other languages like R, C++, and Java, allowing data scientists to leverage the strengths of different tools and libraries. It also integrates well with big data processing frameworks like Apache Spark.
- Machine Learning and AI Capabilities: Python offers popular machine learning libraries such as sci-kit-learn, TensorFlow, and PyTorch. These libraries provide efficient algorithms and tools for tasks like classification, regression, clustering, and deep learning.
- Reproducibility and Scalability: Python’s emphasis on code readability and documentation promotes reproducible research and allows for the creation of scalable data workflows. It supports parallel computing and can handle large datasets efficiently.
- Cross-Domain Applications: Python is not limited to data science. It is a general-purpose programming language, making it suitable for a wide range of applications beyond data analysis, such as web development, automation, and scripting.
How To Pick The Right Python Libraries For Your Needs
When choosing Python libraries for data analysis projects, consider factors such as project requirements, performance, compatibility, learning curve, and long-term viability to make informed decisions and ensure successful implementation.
Here are some steps to help you make an informed decision:
- Identify your requirements. Determine the areas of data science or programming you’ll be working in, such as data manipulation, visualization, machine learning, or natural language processing.
- Research Available Libraries: Look for libraries with active development, good documentation, and a supportive community.
- Evaluate Features and Functionality: Check if it provides the necessary capabilities, algorithms, or tools required for your project. Consider factors such as data handling, model building, visualization options, and integration with other libraries or frameworks.
- Consider Performance and Scalability: Determine if they can handle large datasets efficiently and if they support parallel processing or distributed computing if required.
- Check Compatibility and Integration: Consider how well they integrate with other libraries or technologies you may require for your project.
- Community Support and Documentation: Active communities and comprehensive documentation can provide valuable resources, examples, and assistance when encountering issues or learning how to use a library effectively.
- Experiment and Prototype: This hands-on experience will help you evaluate the ease of use, code readability, and overall suitability of the libraries for your specific needs.
- Consider Long-Term Viability: Check if they have a stable release history, ongoing development, and a strong user base. Libraries that are widely adopted and actively maintained are more likely to receive updates, bug fixes, and new features in the future.
5 Best Python Libraries for Data Analysis and Visualization
Please note that the Python library landscape is constantly evolving, and there are many more libraries available for various purposes. These are just a selection of commonly used ones. Here’s the best Python libraries list
NumPy
NumPy serves as the foundation for numerical computing in Python. Its key feature is the ndarray, a multidimensional array object that enables efficient manipulation of large datasets. NumPy provides a vast array of mathematical functions and operations, including linear algebra, Fourier transforms, random number generation, and more. Its optimized data structures and algorithms make it an indispensable tool for scientific computing.
NumPy, short for Numerical Python, is a fundamental library for numerical computing in Python. It serves as the foundation for scientific computing, data analysis, and machine learning. With its efficient data structures and powerful array manipulation capabilities, NumPy has become a cornerstone of the Python ecosystem. In this blog post, we will delve into the key features and benefits of NumPy, highlighting its role in numerical computing.
NumPy Arrays:
At the heart of NumPy lies the ndarray, a multidimensional array object. NumPy arrays are highly optimized and allow for efficient manipulation of large datasets. These arrays can have any number of dimensions and provide a versatile way to represent and work with numerical data. Whether you are dealing with vectors, matrices, or higher-dimensional arrays, NumPy provides a streamlined interface for performing mathematical operations.
Mathematical Functions and Operations:
NumPy offers an extensive collection of mathematical functions and operations that operate efficiently on arrays. These functions include basic arithmetic operations, trigonometric functions, logarithms, exponentials, and more. NumPy also provides linear algebra operations such as matrix multiplication, matrix inversion, and eigenvalue calculations. Additionally, Fourier transforms random number generation, and statistical functions are readily available in NumPy.
Efficiency and Performance:
One of the primary reasons for NumPy’s popularity is its emphasis on performance. NumPy’s arrays are implemented in C, which allows for efficient memory management and optimized numerical operations. This makes NumPy significantly faster than traditional Python lists when working with large datasets. The ability to perform vectorized operations, where functions are applied to entire arrays, further boosts performance and reduces the need for explicit loops.
Integration with the Python Ecosystem:
NumPy seamlessly integrates with other libraries in the Python data ecosystem. It serves as a foundation for many high-level libraries, such as Pandas for data manipulation and analysis, Matplotlib for data visualization, and scikit-learn for machine learning. NumPy arrays can be easily passed between these libraries, enabling a cohesive and efficient workflow for data analysis and scientific computing.
Conclusion:
NumPy is a powerful library that revolutionizes numerical computing in Python. With its efficient data structures, extensive mathematical functions, and optimized performance, it provides a solid foundation for scientific computing and data analysis tasks. Whether you need to perform complex mathematical operations, manipulate large datasets, or integrate with other libraries, NumPy offers the tools and capabilities to meet your needs. By mastering NumPy, you unlock a world of possibilities in numerical computing and empower yourself to tackle challenging problems with elegance and efficiency.
SciPy
Built on top of NumPy, SciPy offers additional scientific computing capabilities. It encompasses modules for optimization, interpolation, integration, signal and image processing, linear algebra, statistics, and more. Whether you need to solve differential equations or perform statistical analysis, SciPy provides comprehensive functionality. It is widely utilized in scientific research, engineering, and data analysis.
SciPy is a fundamental library that expands the capabilities of NumPy and serves as a cornerstone for scientific and technical computing in Python. By building upon NumPy’s foundation, SciPy provides a comprehensive collection of algorithms and functions for a wide range of scientific domains. In this blog post, we will explore the key features of SciPy and uncover how it empowers researchers, engineers, and data analysts in their scientific computing endeavors.
Functional Modules:
SciPy encompasses various modules that cater to different scientific computing needs. These modules include optimization, interpolation, integration, signal and image processing, linear algebra, statistics, and more. Whether you need to solve complex optimization problems, perform numerical integration, manipulate signals and images, or conduct statistical analysis, SciPy offers powerful and efficient tools to tackle these challenges.
Integration with NumPy:
One of the significant advantages of SciPy is its seamless integration with NumPy. The SciPy modules operate on NumPy arrays, allowing users to leverage the efficient data structures and array manipulation capabilities of NumPy. This integration enables a cohesive workflow and facilitates the exchange of data and computations between the two libraries.
Numerical Simulations and Differential Equations:
SciPy provides extensive support for numerical simulations and solving differential equations. It includes modules like scipy.integrate for numerical integration, scipy.optimize for optimization, and scipy.signal for signal processing. These modules enable researchers and engineers to model and simulate complex systems accurately, making SciPy a valuable tool for scientific research and engineering applications.
Extensive Statistical Functionality:
The scipy.stats module within SciPy offers a comprehensive set of statistical functions and probability distributions. It provides functions for probability density functions (PDFs), cumulative distribution functions (CDFs), statistical tests, descriptive statistics, and more. With scipy.stats, researchers, and data analysts can perform advanced statistical analysis and hypothesis testing, further expanding the capabilities of SciPy.
Conclusion:
SciPy is an indispensable library for scientific and technical computing in Python. By extending the functionality of NumPy, SciPy provides a vast array of tools and algorithms for optimization, interpolation, integration, signal and image processing, linear algebra, statistics, and more. Its integration with NumPy, support for numerical simulations, and extensive statistical functionality make it a powerful asset for researchers, engineers, and data analysts. By harnessing the power of SciPy, users can unlock new possibilities in their scientific computing endeavors and accelerate their progress in various domains.
SymPy
SymPy is a powerful library for symbolic mathematics in Python. It allows manipulation of symbolic expressions, equations, and algebraic operations. With SymPy, users can perform symbolic differentiation, integration, simplification, equation solving, and various other symbolic computations. It is particularly useful for symbolic mathematics, symbolic calculus, and symbolic algebra.
SymPy is a Python library designed for symbolic mathematics, enabling precise manipulation and analysis of mathematical expressions, equations, and algebraic operations. It offers a wide range of tools and functions, including algebraic manipulations, calculus, equation solving, symbolic differentiation, integration, and simplification. SymPy’s intuitive syntax and integration with Python make it accessible to users with varying levels of mathematical expertise.
The advantages of SymPy are numerous. Firstly, it allows for the manipulation of symbolic expressions, making it valuable for tasks like mathematical modeling, physics simulations, and optimization problems. Users can work with mathematical formulas and equations in their exact symbolic form, facilitating precise analysis.
SymPy seamlessly integrates with Python, enabling users to combine symbolic computations with other Python libraries and tools. This integration creates a powerful ecosystem for scientific computing, as symbolic mathematics can be integrated with numerical computations and data analysis.
Being an open-source library, SymPy encourages collaboration, community development, and knowledge sharing. Users can modify or extend the source code to suit their specific needs, fostering continuous improvement and customization.
SymPy also serves as an educational tool, allowing students to explore mathematical concepts and perform calculations interactively. It helps deepen their understanding of abstract mathematical principles through hands-on exploration.
Matplotlib
Matplotlib is a versatile plotting library that facilitates the creation of various visualizations in Python. It offers a wide range of plotting functions and options for generating 2D and 3D plots, histograms, scatter plots, bar charts, and more. Matplotlib’s high customizability enables users to create publication-quality figures. It seamlessly integrates with NumPy and pandas, making it an excellent choice for visualizing data.
Matplotlib, a comprehensive plotting library for Python, empowers data scientists and analysts to create stunning visualizations. In this blog post, we will delve into the world of matplotlib and explore its vast array of plotting functions and customization options. Whether you need to visualize data trends, and create histograms, scatter plots, or bar charts, Matplotlib offers a versatile toolkit to bring your data to life.
A Multitude of Plotting Capabilities:
Matplotlib provides an extensive range of plotting capabilities, allowing users to create a wide variety of plots. From simple line plots and scatter plots to intricate heatmaps and 3D visualizations, Matplotlib offers the flexibility to showcase data in meaningful ways. With its rich set of functions, data exploration and presentation become effortless tasks.
Customization at Your Fingertips:
One of Matplotlib’s key strengths lies in its high customizability. It provides a flexible API that enables users to fine-tune every aspect of their plots. From labels, legends, and color schemes to annotations and plot styles, Matplotlib allows you to tailor your visualizations to suit your specific needs. With just a few lines of code, you can create publication-quality figures that effectively communicate your data insights.
In conclusion, Matplotlib is a powerful and versatile plotting library for Python. With its extensive range of plotting functions and customization options, it enables users to create various types of visualizations, including line plots, scatter plots, bar charts, histograms, and heatmaps. Matplotlib’s integration with NumPy and Pandas further enhances its capabilities for data visualization and analysis. Its ability to generate publication-quality figures makes it a preferred choice for researchers and data scientists seeking to communicate their insights effectively.
Pandas
Pandas is primarily known for its data manipulation and analysis capabilities, but it also provides mathematical functions and operations. pandas introduce data structures like Series and DataFrame, which enable efficient handling of tabular data. It integrates well with NumPy and Matplotlib, facilitating seamless data analysis and visualization. pandas finds applications in various domains, including finance, scientific research, and data-driven decision making.
Pandas is a powerful Python library for data manipulation and analysis. It provides easy-to-use data structures, such as DataFrames and Series, which enable efficient handling of structured data. With its intuitive syntax and extensive functionality, Pandas simplifies tasks like data cleaning, transformation, merging, and analysis.
One of the key features of Pandas is its ability to handle missing data. It provides convenient methods to fill, drop, or interpolate missing values in a dataset. This makes it easier to work with real-world datasets that often contain incomplete or inconsistent data.
Pandas also offers flexible indexing and slicing options, allowing you to select and filter data based on various criteria. You can perform operations like grouping, aggregating, and transforming data using Pandas’ powerful grouping and aggregation functions. These functions enable you to summarize and analyze your data efficiently.
Furthermore, Pandas provides seamless integration with other libraries in the Python data ecosystem. It can read and write data in various file formats, including CSV, Excel, SQL databases, and more. This makes it easy to import and export data from different sources and collaborate with other tools in your data analysis workflow.
Pandas also excel at handling time series data. It supports various time-related operations, such as resampling, shifting, and rolling window calculations. This makes it particularly useful for analyzing and manipulating time-stamped data, such as stock prices, weather data, or sensor readings.
In addition to its data manipulation capabilities, Pandas integrates well with visualization libraries like Matplotlib and Seaborn. This allows you to create insightful plots and charts to visualize your data and gain valuable insights.
Pandas has a large and active community, which means you can find extensive documentation, tutorials, and examples online. This makes it easier to learn and use Pandas effectively in your data analysis projects.
In summary, Pandas is a versatile library for data manipulation and analysis in Python. It provides powerful data structures and functions for manipulating, analyzing, and visualizing structured data. Whether you need to clean and preprocess your data, perform complex data transformations, or gain insights from your data through visualization, Pandas is a valuable tool in your data analysis toolkit.
Conclusion:
Python’s rich ecosystem of libraries for mathematics and scientific computing empowers researchers, engineers, and data scientists to efficiently tackle complex problems. NumPy, SciPy, SymPy, Matplotlib, and pandas offer a wide range of functionalities, from handling large datasets to performing complex mathematical calculations. By leveraging the power of these libraries, users can explore, analyze, and visualize data effectively. Whether you are working on data analysis, scientific research, or engineering projects, these libraries will undoubtedly enhance your productivity and help you gain valuable insights from your data.
Future Of Python For Data Science

The future of Python for data science is promising and shows no signs of slowing down. Python’s rich library ecosystem, friendly syntax, and robust community support all contribute to its success in the data science community. The active Python community continuously enhances data science libraries, ensuring that Python remains at the forefront of the field.
Python’s integration with cutting-edge technologies is another reason for its promising future. It seamlessly interfaces with big data tools like Apache Spark and Hadoop, enabling efficient data processing and analysis. Python’s adaptability and versatility make it a valuable asset in the rapidly evolving landscape of data science.
In the realm of artificial intelligence (AI) and deep learning, Python has established itself as the language of choice. Libraries like TensorFlow, PyTorch, and Keras empower data scientists to develop and deploy complex neural networks. As AI and deep learning applications expand, Python’s significance in these domains is set to grow even further.
Python’s educational focus is also instrumental in its future success. Its straightforward syntax makes it an ideal language for teaching data science concepts, ensuring a steady influx of Python-literate data scientists.
Industry adoption further cements Python’s future. Organizations across various sectors rely on Python for data analysis, predictive modeling, and informed decision-making. This industry demand will continue to propel Python’s growth and development.
Read Next:


